
WEEK 3
Markets
Demand
You will learn about:
You will learn to:
Examine economic issues
Apply economic skills
You will learn about:
- the law of demand, individual and market demand, the demand curve
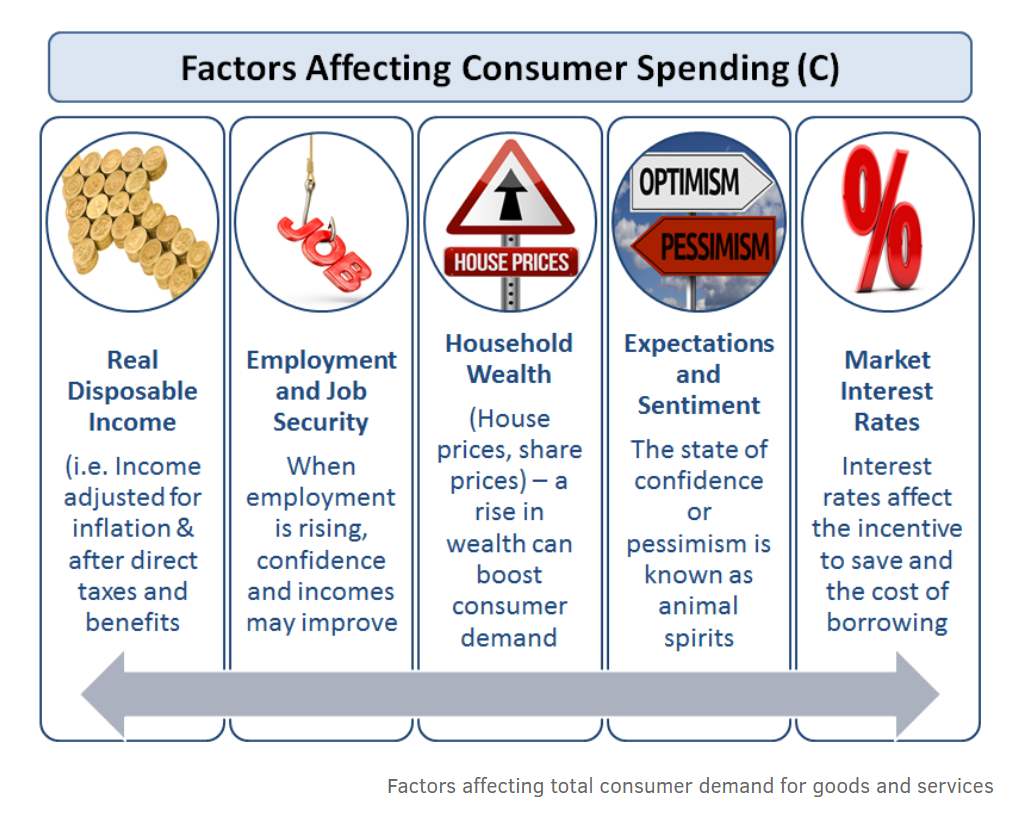
- the factors affecting demand - price, income, population, tastes, prices of substitutes and complements, expected future prices
- movements along the demand curve and shifts of the demand curve
You will learn to:
Examine economic issues
- examine the forces in an economy that tend to cause prices to rise
Apply economic skills
- graph a demand curve and predict the impact of an equilibrium
- calculate the price elasticity of demand using the total outlay method
Traditional economics sets out some basic premises. Let's think these through and see where they are happening in our everyday lives.
- Demand is a function of price and consumers will generally buy less of an expensive product.
- There are a variety of other factors that influence people's choices for consumption, e.g. income, population, tastes, prices of substitutes and complements, expected future prices. These factors cause the whole demand curve to shift left or right.
- Consumers will not react to price changes in some products for particular reasons. This is referred to as inelastic demand.
- Consumers will react immediately to price changes in some products for particular reasons. This is referred to as an elastic demand.
- Inflation describes when the whole economy experiences price rises. Too much money in an economy causes inflation.
Breakfast Cereal- Choosing a Price
Reference: https://core-econ.org/the-economy/book/text/07.html#71-breakfast-cereal-choosing-a-price
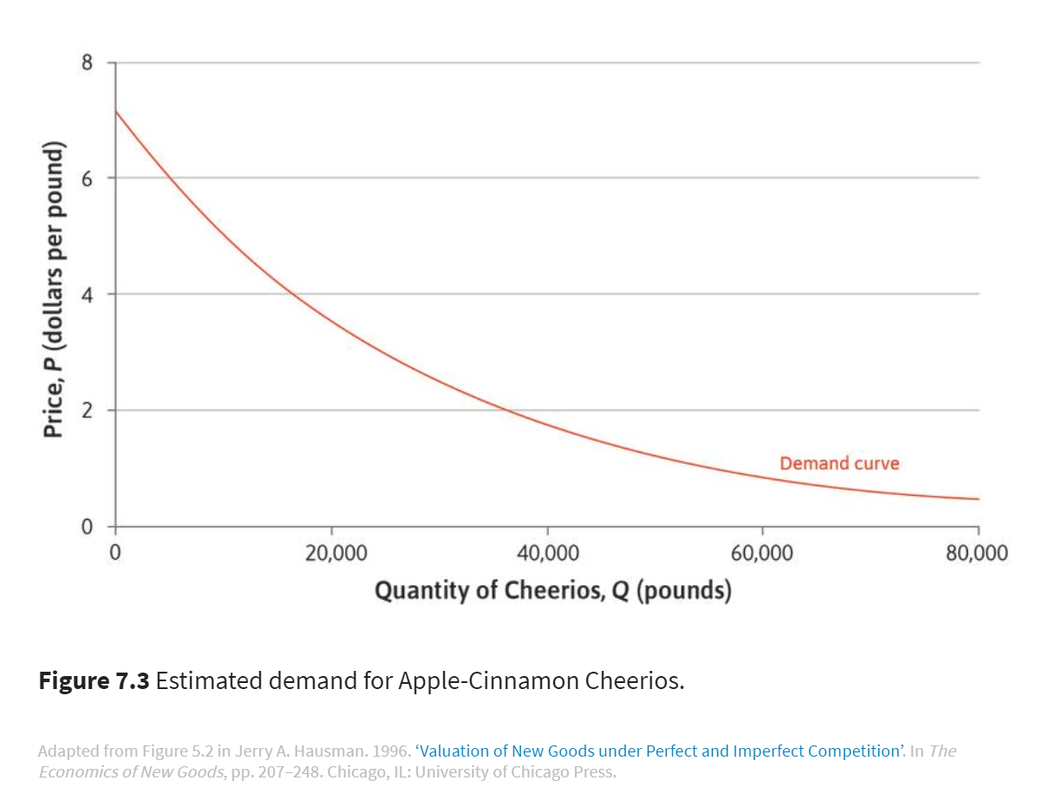
To decide what price to charge, a firm needs information about demand: how much potential consumers are willing to pay for its product. Figure 7.3 shows the demand curve (the curve that gives the quantity consumers will buy at each possible price). for Apple-Cinnamon Cheerios, a ready-to-eat breakfast cereal introduced by the company General Mills in 1989. In 1996, Jerry Hausman, an economist, used data on weekly sales of family breakfast cereals in US cities to estimate how the weekly quantity of cereal that customers in a typical city would wish to buy would vary with its price per pound (there are 2.2 pounds in 1 kg). For example, you can see from Figure 7.3 that if the price were $3, customers would demand 25,000 pounds of Apple-Cinnamon Cheerios. For most products, the lower the price, the more customers wish to buy.
To decide what price to charge, a firm needs information about demand: how much potential consumers are willing to pay for its product. Figure 7.3 shows the demand curve (the curve that gives the quantity consumers will buy at each possible price). for Apple-Cinnamon Cheerios, a ready-to-eat breakfast cereal introduced by the company General Mills in 1989. In 1996, Jerry Hausman, an economist, used data on weekly sales of family breakfast cereals in US cities to estimate how the weekly quantity of cereal that customers in a typical city would wish to buy would vary with its price per pound (there are 2.2 pounds in 1 kg). For example, you can see from Figure 7.3 that if the price were $3, customers would demand 25,000 pounds of Apple-Cinnamon Cheerios. For most products, the lower the price, the more customers wish to buy.

Click on the link above to find out more.
Nerd Alert
If you were the manager at General Mills, how would you choose the price for Apple-Cinnamon Cheerios in this city, and how many pounds of cereal would you produce?
You need to consider how the decision will affect your profits (the difference between sales revenue and production costs). Suppose that the unit cost (the cost of producing each pound) of Apple-Cinnamon Cheerios is $2. To maximize your profit, you should produce exactly the quantity you expect to sell, and no more. Then revenue, costs, and profit are given by:
Total Costs = Unit Cost X Quantity
= 2 X Q
Total Revenue = Price X Quantity
= P X Q
Profit = Total Revenue - Total Costs
= (P X Q) - (2 X Q)
So we have a formula for profit:
Profit=(P−2)×Q
Using this formula, you could calculate the profit for any choice of price and quantity and draw the isoprofit curves, as in Figure 7.4. Just as indifference curves join points in a diagram that give the same level of utility, isoprofit curves join points that give the same level of total profit. We can think of the isoprofit curves as the firm’s indifference curves: the firm is indifferent between combinations of price and quantity that give you the same profit.
Want to know more? Head to this link to read and answer some demand-ing questions!
Can you bring a demand curve to life?
Are economists faking it until they make it?
You know it's there, when a price goes up you generally buy less of it and conversely, when a price goes down, you will go and buy more.
But it's hard to find a real demand curve. Listen to this podcast from Freakonomics and hear how Uber has provided economists with enough data to nail a demand curve down.

In your first assessment task you are researching factors around consumer's spending and saving patterns. This information will help you develop a rationale and move ahead with your research.
How does this all come together?

Price Elasticity -
how quickly will consumers react when you change a price?
|
One of the critical elements of pricing is understanding what economists call price elasticity.
Reference: https://hbr.org/2015/08/a-refresher-on-price-elasticity 
|
|
What is price elasticity?
Most customers in most markets are sensitive to the price of a product or service, and the assumption is that more people will buy the product or service if it’s cheaper and less will buy it if it’s more expensive. But the phenomenon is more quantifiable than that, and price elasticity shows exactly how responsive customer demand is for a product based on its price. “Marketers need to understand how elastic, sensitive to fluctuations in price, or inelastic, largely ambivalent about price changes, their products are when contemplating how to set or change a price,” says Avery.
“Some products have a much more immediate and dramatic response to price changes, usually because they’re considered nice-to-have or non-essential, or because there are many substitutes available,” explains Avery. Take for example, beef. When the price dramatically increases, demand may go way down because people can easily substitute chicken or pork.
How is it calculated?
This is the formula for price elasticity of demand:
Price elasticity of demand = % change in Qdd
% change in P
Let’s look at an example. Say that a clothing company raised the price of one of its coats from $100 to $120. The price increase is $120-$100/$100 or 20%. Now let’s say that the increase caused a decrease in the quantity sold from 1,000 coats to 900 coats. The percentage decrease in demand is -10%. Plugging those numbers into the formula, you’d get a price elasticity of demand of:
-.10 = -.5 or .5
.20
Products and services can be:
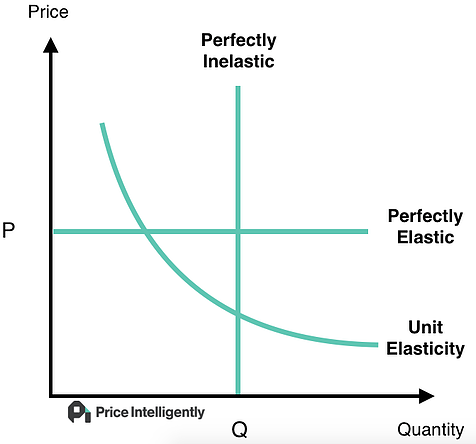
- Perfectly elastic where any very small change in price results in a very large change in the quantity demanded. Products that fall in this category are mostly “pure commodities,” says Avery. “There’s no brand, no product differentiation, and customers have no meaningful attachment to the product.”
- Relatively elastic where small changes in price cause large changes in quantity demanded (the result of the formula is greater than 1). Beef, as discussed above, is an example of a product that is relatively elastic.
- Unit elastic where any change in price is matched by an equal change in quantity (where the number is equal to 1).
- Relatively inelastic where large changes in price cause small changes in demand (the number is less than 1). Gasoline is a good example here because most people need it, so even when prices go up, demand doesn’t change greatly. Also, “products with stronger brands tend to be more inelastic, which makes building brand equity a good investment,” says Avery.
- Perfectly inelastic where the quantity demanded does not change when the price changes. Products in this category are things consumers absolutely need and there are no other options from which to obtain them. “We tend to see this only in cases where a firm has a monopoly on the demand. Even if I change my price, you still have to buy from me,” explains Avery.
