
WEEK 8
Labour Markets
The Australian Workforce
You will learn about the:
– unemployed
You will learn to:
Examine economic issues
Apply economic skills
Economics sets out some basic premises about labour markets. Let's think these through and see where they are happening in our everyday lives.
You will learn about the:
- definition of the workforce
– unemployed
- general characteristics of the Australian workforce
You will learn to:
Examine economic issues
- investigate recent trends in unemployment in Australia
- compare and contrast unemployment levels in different parts of Australia
Apply economic skills
- research an outcome of the contemporary Australian labour market
Economics sets out some basic premises about labour markets. Let's think these through and see where they are happening in our everyday lives.
- The size of the workforce is determined by the participation rate, population size and age distribution of the population
- The ageing population in Australia is a critical issue
- Unemployment refers to when someone does not have a job but is actively looking for employment
- There are different types of unemployment, including cyclical, structural, frictional and seasonal
- People may also be underemployed or hidden or become unemployed in the long-term
- There is a natural rate of unemployment, around 4.5-5%, referred to as the non-accelerating inflation rate of unemployment (click on the link to find out about NAIRU-->NAIRU)
- Part-time work and the casualisation of the workforce has had a significant impact on the Australian labour market
The Workforce
Reference: Class text (Dixon & O'Mahony, 2021, p. 194)
The workforce is the total number of people who are working or have the potential to work, sometimes also referred to as the labour force. It includes people who are working and people who are willing to work but are not employed.
The ABS regularly collects information on the labour force. Click on the image to find out who IS and IS NOT COUNTED. Record this important information in your workbook.
The participation rate measures the percentage of the working age population that is involved in the workforce. It is represented in this formula:
labour force X 100%
working age population (everyone 15yo +)
labour force X 100%
working age population (everyone 15yo +)
To be included as unemployed, criteria must be met. They include all people who were waiting to start work and were available to start in the reference week for the ABS survey. From April 1986, the definition of employed people was changed to include people who worked without pay between 1 and 14 hours per week in a family business or on a farm (i.e. contributing family workers).
The ABS undertakes the Labour Force Survey which covers approximately 0.32% of the civilian population of Australia aged 15 years and over. Households selected for the Labour Force Survey are interviewed each month for eight months, with one-eighth of the sample being replaced each month.
The ABS then calculates the total figures using this sample.
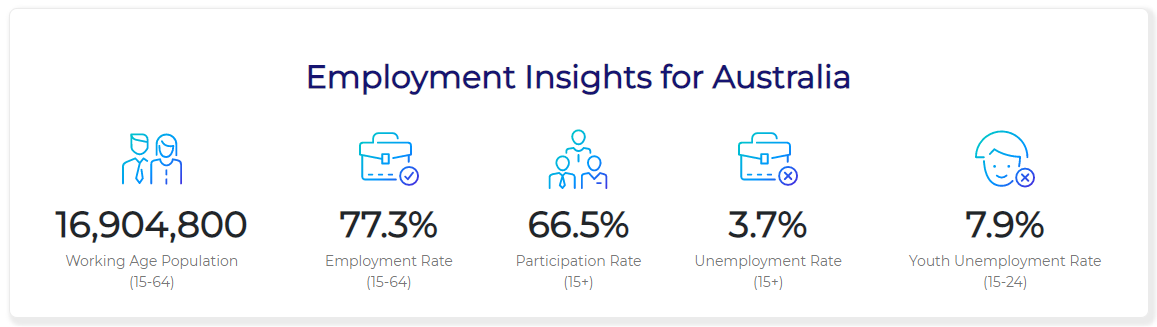
Use the link "ABS Latest Figures" and answer these questions:
(a) In the summary table under "Key statistics", how many people were recorded looking for work in the latest data?
(b) In the same table, what is the recorded participation rate?
(c) Did people work more in October 2022 or September 2022? Explain your answer. Answer hidden here (highlight to reveal):
Read this information, from the same site:
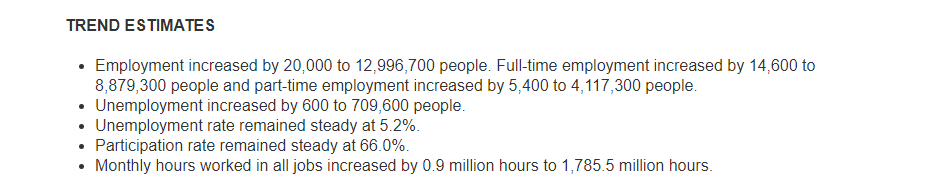
How can employment AND unemployment increase together? Try and talk it out with another apprentice economist.
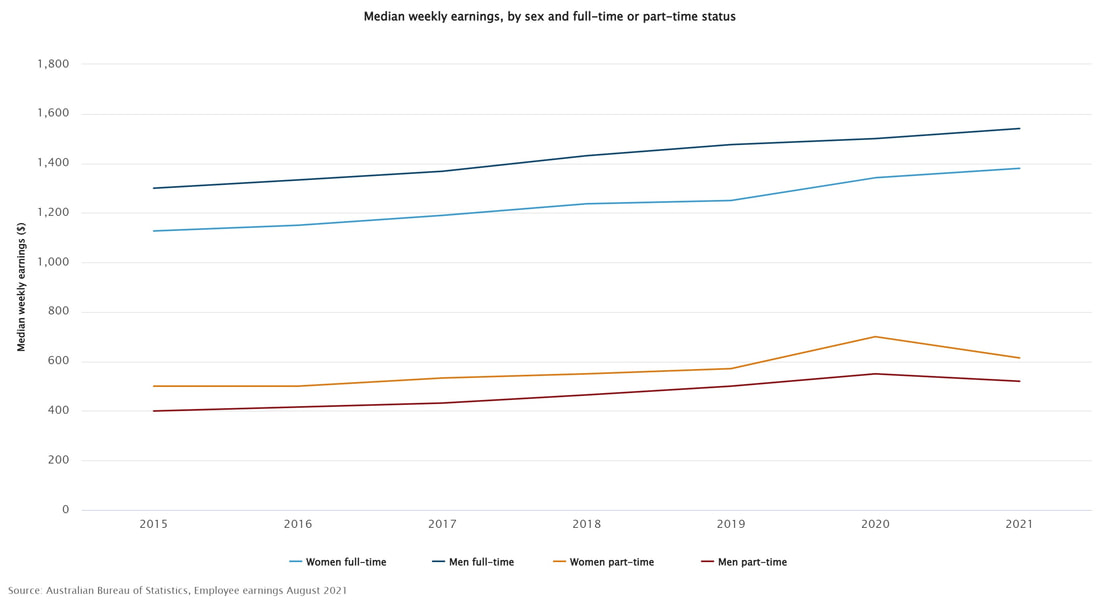
Click on the image "Median Weekly Earnings by Sex and Full-time or Part-time".
What conclusions can you draw from this graph?
Click on the image "Median Weekly Earnings by Sex and Full-time or Part-time".
What conclusions can you draw from this graph?
On the same site, scroll through the following graphs and answer the questions following.
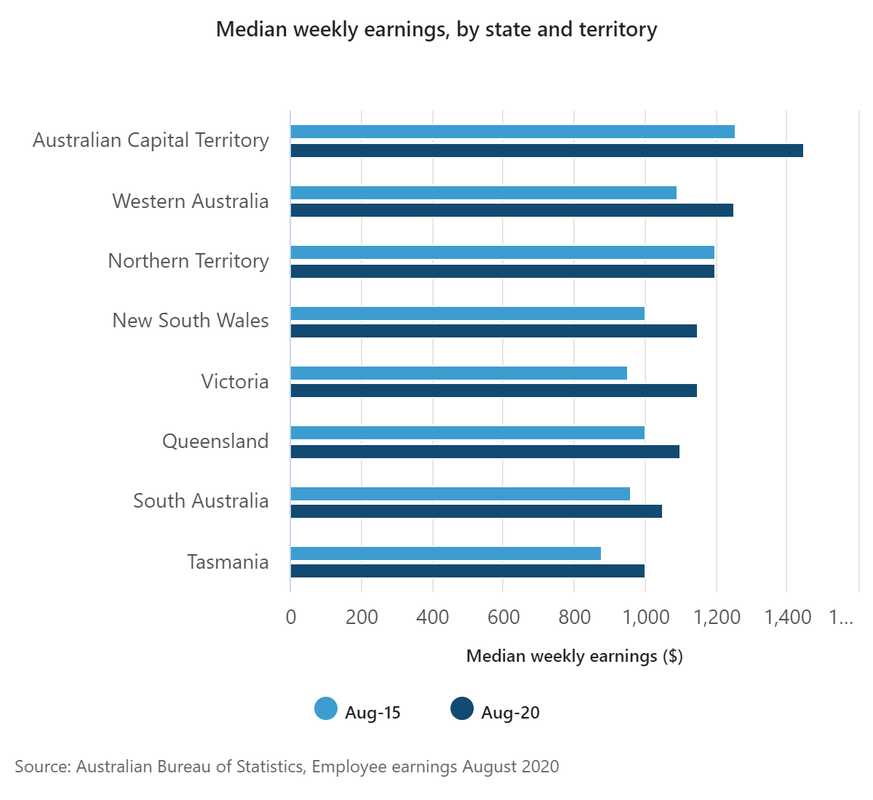
Median Weekly Earnings for Employees by State and Territory
Median Weekly Earnings for Employees by State and Territory
Look for:
Median Hourly Earnings for Employees by Occupation
Median Weekly Earnings for Employees by Industry
Median Weekly Earnings by Highest Educational Qualification
What are the characteristics of the highest paid workers currently in Australia, e.g. gender, state or territory of residence, occupation and industry, relevant educational qualifications and current working arrangements?
For EACH graph record an important characteristic of the Australian labour market.
For e.g. The median weekly earnings for employees in the ACT has increased by $194 to $1,450 since August 2015.
You can share your factfile with others to increase your labour productivity.
